Tiedosto:Table isotopes en.svg

Tämän PNG-esikatselun koko koskien SVG-tiedostoa: 419 × 600 kuvapistettä. Muut resoluutiot: 168 × 240 kuvapistettä | 335 × 480 kuvapistettä | 537 × 768 kuvapistettä | 715 × 1 024 kuvapistettä | 1 431 × 2 048 kuvapistettä | 580 × 830 kuvapistettä.
Alkuperäinen tiedosto (SVG-tiedosto; oletustarkkuus 580 × 830 kuvapistettä; tiedostokoko 215 KiB)
| Tämä tiedosto on tiedostotietokanta Wikimedia Commonsista. Tiedot kuvaussivulta näkyvät alla. |  |
Tiedoston kuvaussivu Commonsissa |
Yhteenveto
| Kuvaus |
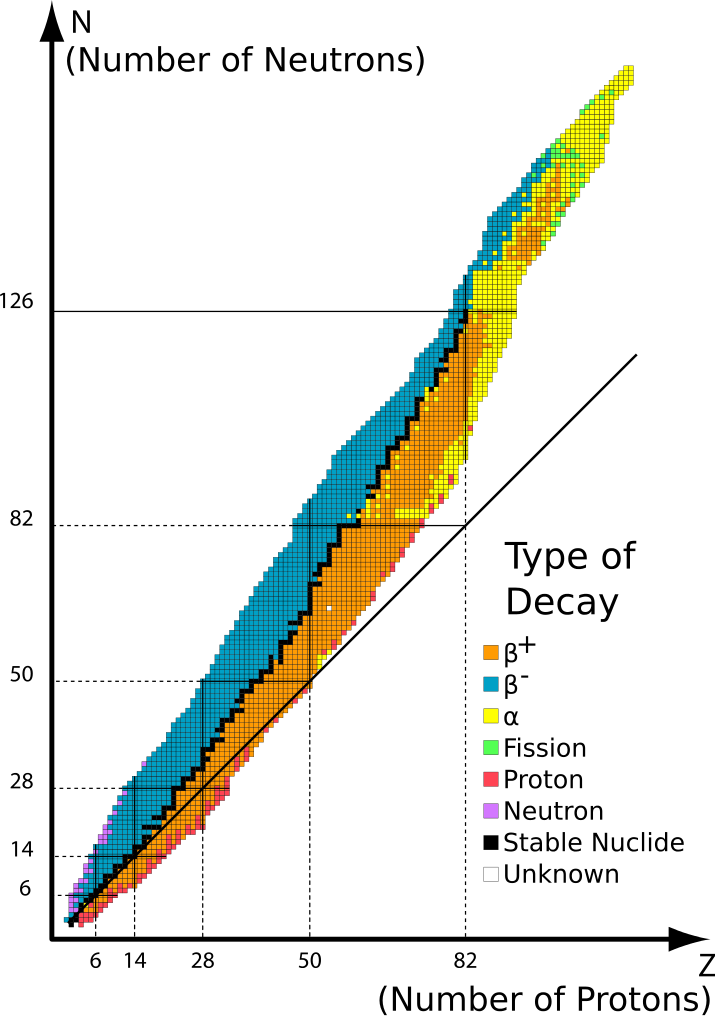
Deutsch: Auftragung von Isotopen nach Art des radioaktiven Zerfalls. Orange und blaue Nuklide sind instabil, schwarze Kästen dazwischen zeigen stabile Nuklide. Die durchgezogene Linie repräsentiert die theoretische Position der Nuklide bei der Protonen- und Neutronenanzahl identisch sind. Es zeigt sich, dass Elemente mit mehr als 20 Protonen mehr Neutronen benötigen um stabil zu sein.
English: Graph of isotopes by type of nuclear decay. Orange and blue nuclides are unstable, with the black squares between these regions representing stable nuclides. The unbroken line passing below many of the nuclides represents the theoretical position on the graph of nuclides for which proton number is the same as neutron number. The graph shows that elements with more than 20 protons must have more neutrons than protons, in order to be stable.
Français : Table des isotopes par type de désintégration majoritaire, convertie depuis les données du programme Nucleus. |
| Päiväys | (UTC) |
| Lähde | |
| Tekijä |
|
| Muut versiot |
Tämän tiedoston johdannaisteoksia: []
|


Lisenssi
Minä, tämän teoksen tekijänoikeuksien haltija, julkaisen täten tämän teoksen seuraavilla lisensseillä:
Tämä tiedosto on lisensoitu Creative Commons Nimeä-JaaSamoin 3.0 Ei sovitettu, 2.5 Yleinen, 2.0 Yleinen ja 1.0 Yleinen -lisensseillä.
- Voit:
- jakaa – kopioida, levittää ja esittää teosta
- remiksata – valmistaa muutettuja teoksia
- Seuraavilla ehdoilla:
- nimeäminen – Sinun on mainittava lähde asianmukaisesti, tarjottava linkki lisenssiin sekä merkittävä, mikäli olet tehnyt muutoksia. Voit tehdä yllä olevan millä tahansa kohtuullisella tavalla, mutta et siten, että annat ymmärtää lisenssinantajan suosittelevan sinua tai teoksen käyttöäsi.
- jaa samoin – Jos muutat tai perustat tähän työhön, voit jakaa tuloksena syntyvää työtä vain tällä tai tämän kaltaisella lisenssillä.

|
Voit kopioida, levittää ja/tai muuttaa tätä asiakirjaa GNU Free Documentation License -lisenssin version 1.2 tai minkä tahansa Free Software Foundationin julkaiseman myöhemmän version ehtojen alaisena; ei koske muuttumattomia kohtia, etukannen tekstejä eikä takakannen tekstejä. Kopio tästä lisenssistä on saatavilla osiossa GNU Free Documentation License. |
Voit valita haluamasi lisenssin.
Alkuperäinen tallennusloki
This image is a derivative work of the following images:
- File:Table_isotopes.svg licensed with Cc-by-sa-3.0,2.5,2.0,1.0, GFDL
- 2008-05-21T21:32:39Z Napy1kenobi 580x830 (617205 Bytes) Table des isotopes par type de désintégration majoritaire, convertie depuis les données du programme Nucleus, fond caché sous Inkscape retiré. [[Category:Chart of nuclides]] [[Category:Decay]]
- 2008-05-21T21:29:04Z Napy1kenobi 842x830 (1084210 Bytes) {{Information |Description=Table des isotopes par type de désintégration majoritaire, convertie depuis les données du programme Nucleus. |Source=travail personnel |Date=2008-05-21 |Author= [[User:Napy1kenobi|Napy1kenobi]]
Uploaded with derivativeFX
| Annotations | This image is annotated: View the annotations at Commons |
Tiedoston historia
Päiväystä napsauttamalla näet, millainen tiedosto oli kyseisellä hetkellä.
| Päiväys | Pienoiskuva | Koko | Käyttäjä | Kommentti | |
|---|---|---|---|---|---|
| nykyinen | 5. huhtikuuta 2010 kello 05.18 | | 580 × 830 (215 KiB) | Quibik | Made the source code more compact. |
| 5. toukokuuta 2009 kello 12.25 |  | 580 × 830 (695 KiB) | Sjlegg | {{Information |Description=Table of isotopes by type of nuclear decay. |Source=*File:Table_isotopes.svg |Date=2009-05-05 10:23 (UTC) |Author=*File:Table_isotopes.svg: Napy1kenobi *derivative work: ~~~ |Permission=see below |
Tiedoston käyttö
Seuraava sivu käyttää tätä tiedostoa:
Tiedoston järjestelmänlaajuinen käyttö
Seuraavat muut wikit käyttävät tätä tiedostoa:
- Käyttö kohteessa az.wikipedia.org
- Käyttö kohteessa beta.wikiversity.org
- Käyttö kohteessa bn.wikipedia.org
- Käyttö kohteessa ca.wikipedia.org
- Käyttö kohteessa el.wikipedia.org
- Käyttö kohteessa en.wikipedia.org
- Käyttö kohteessa en.wikibooks.org
- Käyttö kohteessa en.wikiversity.org
- User:Marshallsumter/Keynote lectures (draft)/Geology
- Draft:Original research/Radiation
- User:Marshallsumter/Radiation astronomy/Electrons
- User:Marshallsumter/Radiation astronomy1/Positrons
- User:Marshallsumter/Keynote lectures (draft)/Neutron radiation astronomy
- User:Marshallsumter/Radiation astronomy1/Neutrinos
- User:Marshallsumter/Radiation astronomy2/Subatomics
- User:Marshallsumter/Radiation astronomy/Beta particles
- Draft:Original research/Nuclear physics
- Radiation/Neutrons
- User:Marshallsumter/Radiation astronomy2/Transmutations
- Charges/Nuclear physics
- Chemicals/Borons
- Käyttö kohteessa es.wikipedia.org
- Käyttö kohteessa fa.wikipedia.org
- Käyttö kohteessa fr.wikipedia.org
- Käyttö kohteessa he.wikipedia.org
- Käyttö kohteessa hi.wikiversity.org
- Käyttö kohteessa hr.wikipedia.org
- Käyttö kohteessa hu.wikipedia.org
- Käyttö kohteessa id.wikipedia.org
- Käyttö kohteessa ja.wikipedia.org
- Käyttö kohteessa ms.wikipedia.org
- Käyttö kohteessa pnb.wikipedia.org
- Käyttö kohteessa sv.wikipedia.org
- Käyttö kohteessa sv.wikibooks.org
- Käyttö kohteessa ta.wikipedia.org
Näytä lisää tämän tiedoston järjestelmänlaajuista käyttöä.