Tiedosto:2005cobalt (mined).PNG
Tämän esikatselun koko: 800 × 351 kuvapistettä. Muut resoluutiot: 320 × 140 kuvapistettä | 640 × 281 kuvapistettä | 1 425 × 625 kuvapistettä.
Alkuperäinen tiedosto (1 425 × 625 kuvapistettä, 58 KiB, MIME-tyyppi: image/png)
| Tämä tiedosto on tiedostotietokanta Wikimedia Commonsista. Tiedot kuvaussivulta näkyvät alla. | .PNG?uselang=fi) |
Tiedoston kuvaussivu Commonsissa |
Yhteenveto
| Kuvaus |
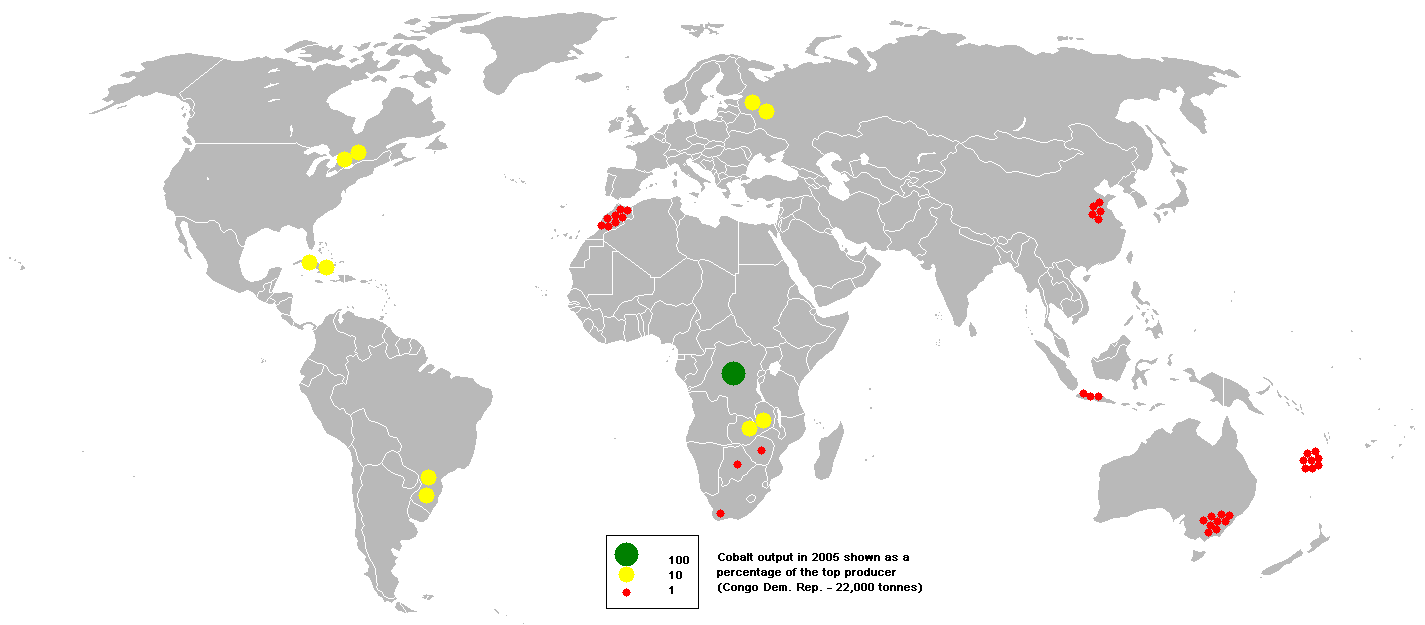
English: This bubble map shows the global distribution of mined output of cobalt in 2005 as a percentage of the top producer (Congo Dem. Rep. - 22,000 tonnes).
This map is consistent with incomplete set of data too as long as the top producer is known. It resolves the accessibility issues faced by colour-coded maps that may not be properly rendered in old computer screens. Data was extracted on 3rd June 2007. Source - http://www.bgs.ac.uk/mineralsuk/commodity/world/home.html Based on :Image:BlankMap-World.png |
| Päiväys | 3. kesäkuuta 2007 (alkuperäinen tallennuspäivä) |
| Lähde | Siirretty projektista en.wikipedia Commonsiin käyttäjän Stefan4 toimesta työkalulla CommonsHelper. |
| Tekijä | Anwar saadat projektissa Wikipedia kielellä englanti |
Lisenssi
Anwar saadat projektissa Wikipedia kielellä englanti, tämän teoksen tekijänoikeuksien haltija, julkaisee täten tämän teoksen seuraavalla lisenssillä:
Tämä tiedosto on lisensoitu Creative Commons Nimeä-JaaSamoin 3.0 Ei sovitettu -lisenssillä.
Nimeä: Anwar saadat projektissa Wikipedia kielellä englanti
- Voit:
- jakaa – kopioida, levittää ja esittää teosta
- remiksata – valmistaa muutettuja teoksia
- Seuraavilla ehdoilla:
- nimeäminen – Sinun on mainittava lähde asianmukaisesti, tarjottava linkki lisenssiin sekä merkittävä, mikäli olet tehnyt muutoksia. Voit tehdä yllä olevan millä tahansa kohtuullisella tavalla, mutta et siten, että annat ymmärtää lisenssinantajan suosittelevan sinua tai teoksen käyttöäsi.
- jaa samoin – Jos muutat tai perustat tähän työhön, voit jakaa tuloksena syntyvää työtä vain tällä tai tämän kaltaisella lisenssillä.
Alkuperäinen tallennusloki
Alkuperäinen kuvaussivu oli täällä. Käyttäjätunnukset alla viittaavat kohteeseen en.wikipedia.
- 2007-06-03 13:08 Anwar saadat 1425×625× (59689 bytes)
Tiedoston historia
Päiväystä napsauttamalla näet, millainen tiedosto oli kyseisellä hetkellä.
| Päiväys | Pienoiskuva | Koko | Käyttäjä | Kommentti | |
|---|---|---|---|---|---|
| nykyinen | 10. marraskuuta 2011 kello 23.25 | | 1 425 × 625 (58 KiB) | File Upload Bot (Magnus Manske) | {{BotMoveToCommons|en.wikipedia|year={{subst:CURRENTYEAR}}|month={{subst:CURRENTMONTHNAME}}|day={{subst:CURRENTDAY}}}} {{Information |Description={{en|This bubble map shows the global distribution of mined outp |
Tiedoston käyttö
Seuraava sivu käyttää tätä tiedostoa:
Tiedoston järjestelmänlaajuinen käyttö
Seuraavat muut wikit käyttävät tätä tiedostoa:
.PNG)