#
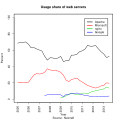
# File: ws-usage-2005-2021.R
#
# The percentages of usage of servers are taken from the table and graph diagram
# reported in "Web Server Survey" page (found in Netcraft website)
# which are named: "Web servers developers: Market share of all sites".
# If the percentage of a web server developer goes below the standard threshold limit,
# then it is no more named in text below Netcraft graph diagram but its integer
# (without decimals) percentage of usage can be shown by pointing mouse cursor
# under the last point of one of the curves of the diagram graph.
# So the percentage of that historical web developer can be reported
# in its data table (see below) in order to continue to track it.
#
# NOTE: percentages about Microsoft, Google (since 2021) and
#       "other" web servers have been rounded to integer part (no decimals).
#
# NOTE: to create this image file (see below: server.file) in Windows:
#       - install R software from: https://www.r-project.org/
#       - open a terminal window
#       - set PATH=%PATH%;"C:\Program Files\R\R-4.1.2\bin"
#       - rscript ws-usage-2005-2021.R
#

server.names = c(
 	"Apache",
 	"Microsoft",
 	"nginx",
 	"Google",
 	"OpenResty",
 	"Cloudflare",
 	"Other"
 )

 server.years = c(
 	2005.0,2005.25,2005.5,2005.75,
 	2006.0,2006.25,2006.5,2006.75,
 	2007.0,2007.25,2007.5,2007.75,
 	2008.0,2008.25,2008.5,2008.75,
 	2009.0,2009.25,2009.5,2009.75,
 	2010.0,2010.25,2010.5,2010.75,
 	2011.0,2011.25,2011.5,2011.75,
 	2012.0,2012.25,2012.5,2012.75,
 	2013.0,2013.25,2013.5,2013.75,
 	2014.0,2014.25,2014.5,2014.75,
 	2015.0,2015.25,2015.5,2015.75,
 	2016.0,2016.25,2016.5,2016.75,
 	2017.0,2017.25,2017.5,2017.75,
 	2018.0,2018.25,2018.5,2018.75,
 	2019.0,2019.25,2019.5,2019.75,
 	2020.0,2020.25,2020.5,2020.75,
 	2021.0,2021.25,2021.5,2021.75
 )

 #Use the first month of the quarter:  January, April, July, October
 server.apache = c(
 	68.43, 69.32, 69.60, 69.89, #2005
 	67.11, 62.72, 63.09, 61.44, #2006
 	60.17, 58.86, 52.65, 47.73, #2007
 	50.61, 50.42, 49.49, 50.43, #2008
 	52.26, 45.95, 47.17, 46.90, #2009
 	53.84, 53.93, 54.90, 58.07, #2010
 	59.13, 61.13, 65.86, 64.67, #2011
 	64.91, 65.46, 61.45, 58.00, #2012
 	55.26, 51.01, 52.19, 44.89, #2013
 	41.64, 37.74, 34.73, 37.45, #2014
 	39.74, 39.25, 38.34, 34.53, #2015
 	33.56, 26.96, 31.72, 23.84, #2016
 	21.51, 22.69, 17.83, 18.78, #2017
 	27.21, 25.58, 22.00, 22.98, #2018
    21.30, 26.73, 27.75, 28.64, #2019
    23.98, 24.73, 25.45, 27.04, #2020
    26.38, 25.90, 25.61, 24.63  #2021

 )

 server.microsoft = c(
 	20.86, 20.45, 20.53, 20.55, #2005
 	20.61, 25.22, 29.48, 31.35, #2006
 	30.78, 31.13, 32.84, 37.13, #2007
 	35.81, 35.33, 35.57, 34.44, #2008
 	32.91, 29.27, 23.34, 21.58, #2009
 	24.08, 24.97, 25.87, 22.99, #2010
 	21.00, 18.83, 16.82, 15.66, #2011
 	14.46, 13.66, 14.62, 16.28, #2012
 	16.93, 19.95, 19.65, 23.10, #2013
 	29.42, 33.04, 37.53, 33.58, #2014
 	27.52, 27.83, 26.52, 30.40, #2015
 	28.95, 40.75, 35.26, 44.61, #2016
 	45.66, 44.71, 53.17, 49.44, #2017
 	31.85, 36.94, 40.28, 39.22, #2018
    31.96, 25.05, 14.59, 14.08, #2019
    14.03, 12.85, 11.36, 7.66,  #2020
     7.49,  5.54,  4.20, 4.00   #2021
 )

 server.nginx = c(
 	NA, NA, NA, NA, #2005
 	NA, NA, NA, NA, #2006
 	NA, NA, NA, NA, #2007
 	NA, NA, NA, NA, #2008
 	1.87, 2.64, 4.25, 5.99, #2009
 	7.53, 6.32, 5.58, 6.07, #2010
 	7.50, 7.50, 6.54, 8.54, #2011
 	9.63, 10.32, 11.09, 11.80, #2012
 	12.64, 14.81, 13.60, 16.05, #2013
 	14.40, 15.25, 14.16, 14.42, #2014
 	14.61, 14.87, 15.47, 16.65, #2015
 	15.60, 13.23, 15.92, 13.77, #2016
 	17.63, 19.22, 15.05, 18.40, #2017
 	25.39, 22.62, 17.25, 19.72, #2018
    24.74, 27.52, 34.59, 32.88, #2019
    37.70, 36.91, 36.55, 34.24, #2020
    33.33, 36.65, 36.54, 34.95  #2021
 )

 server.google = c(
 	NA, NA, NA, NA, #2005
 	NA, NA, NA, NA, #2006
 	NA, NA, 4.35, 5.44, #2007
 	5.33, 6.08, 5.70, 5.76, #2008
 	5.32, 3.12, 5.94, 6.00, #2009
 	7.04, 6.70, 7.70, 6.43, #2010
 	5.53, 4.70, 4.38, 3.47, #2011
 	3.25, 3.26, 3.44, 3.38, #2012
 	3.58, 3.50, 3.92, 4.45, #2013
 	2.47, 2.19, 2.06, 1.89, #2014
 	2.30, 2.36, 2.38, 2.27, #2015
 	2.29, 1.90, 2.10, 1.51, #2016
 	1.00, 1.05, 1.18, 1.16, #2017
 	1.20, 1.26, 1.40, 1.41, #2018
    1.58, 1.80, 2.11, 2.68, #2019
    3.02, 3.42, 3.59, 3.86, #2020
    3.86, 3.90, 4.10, 4.00  #2021
 )

 server.openresty = c(
 	NA, NA, NA, NA, #2005
 	NA, NA, NA, NA, #2006
 	NA, NA, NA, NA, #2007
 	NA, NA, NA, NA, #2008
 	NA, NA, NA, NA, #2009
 	NA, NA, NA, NA, #2010
 	NA, NA, NA, NA, #2011
 	NA, NA, NA, NA, #2012
 	NA, NA, NA, NA, #2013
 	NA, NA, NA, NA, #2014
 	NA, NA, NA, NA, #2015
 	NA, NA, NA, NA, #2016
 	NA, NA, NA, NA, #2017
 	NA, NA, NA, NA, #2018
 	NA, NA, NA, NA, #2019
 	NA, NA, NA, NA, #2020
 	NA, 6.76, 6.20, 6.45 #2021
 )

 server.cloudflare = c(
 	NA, NA, NA, NA, #2005
 	NA, NA, NA, NA, #2006
 	NA, NA, NA, NA, #2007
 	NA, NA, NA, NA, #2008
 	NA, NA, NA, NA, #2009
 	NA, NA, NA, NA, #2010
 	NA, NA, NA, NA, #2011
 	NA, NA, NA, NA, #2012
 	NA, NA, NA, NA, #2013
 	NA, NA, NA, NA, #2014
 	NA, NA, NA, NA, #2015
 	NA, NA, NA, NA, #2016
 	NA, NA, NA, NA, #2017
 	NA, NA, NA, NA, #2018
 	NA, NA, NA, NA, #2019
 	NA, NA, NA, NA, #2020
 	NA, NA, 4.49, 4.87 #2021
 )

 server.other = c(
 	 8.00,  7.00,  7.00,  7.00, #2005
 	10.00, 10.00,  7.00,  7.00, #2006
 	 7.00,  8.00,  8.00,  8.00, #2007
 	 7.00,  7.00,  8.00,  8.00, #2008
 	 7.00, 19.00, 19.00, 19.00, #2009
 	 7.00,  8.00,  8.00,  6.00, #2010
 	 7.00,  8.00,  6.00,  7.00, #2011
 	 7.00,  7.00,  9.00, 10.00, #2012
 	11.00, 10.00, 10.00, 11.00, #2013
 	12.00, 11.00, 11.00, 12.00, #2014
 	15.00, 15.00, 16.00, 15.00, #2015
 	18.00, 16.00, 14.00, 14.00, #2016
 	13.00, 11.00, 11.00, 10.00, #2017
 	12.00, 11.00, 16.00, 13.00, #2018
    16.00, 14.00, 15.00, 15.00, #2019
    13.00, 14.00, 13.00, 14.00, #2020
    16.00, 15.00, 16.00, 18.00  #2021
 )

 server.title = "Usage share of web servers"
 server.sub = "Source:  Netcraft"
 server.file = "Usage share of web servers (Source Netcraft).svg"

 svg(file=server.file,width=12,height=7)
 par(lwd=2)
 plot(server.years, server.apache, type="l", ylim=c(0, 100), main=server.title, sub=server.sub, xlab="Year", ylab="Percent", col=1, xaxt="n")
 axis(1, at=2005:2021, las=2)
 lines(server.years, server.microsoft,  col=2)
 lines(server.years, server.nginx,      col=3)
 lines(server.years, server.google,     col=4)
 lines(server.years, server.openresty,  col=5)
 lines(server.years, server.cloudflare, col=6)
 lines(server.years, server.other,      col=7)

 legend("topright",inset=0.05,col=1:7,lwd=3,legend=server.names)
 dev.off()


