Tiedosto:Simpson's paradox continuous.svg

Tämän PNG-esikatselun koko koskien SVG-tiedostoa: 390 × 260 kuvapistettä. Muut resoluutiot: 320 × 213 kuvapistettä | 640 × 427 kuvapistettä | 1 024 × 683 kuvapistettä | 1 280 × 853 kuvapistettä | 2 560 × 1 707 kuvapistettä.
Alkuperäinen tiedosto (SVG-tiedosto; oletustarkkuus 390 × 260 kuvapistettä; tiedostokoko 18 KiB)
| Tämä tiedosto on tiedostotietokanta Wikimedia Commonsista. Tiedot kuvaussivulta näkyvät alla. |  |
Tiedoston kuvaussivu Commonsissa |
W3C-validity not checked.
Yhteenveto
| Kuvaus |
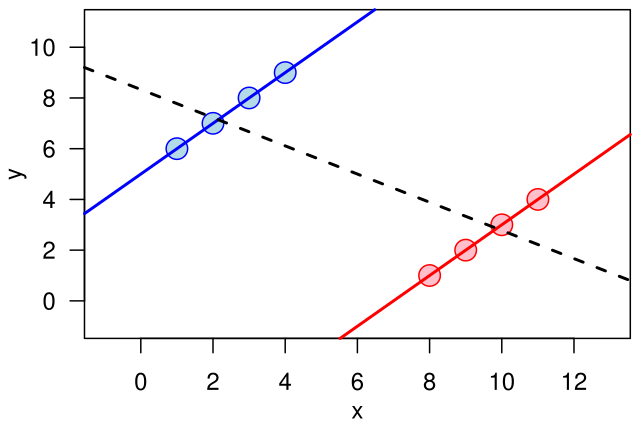
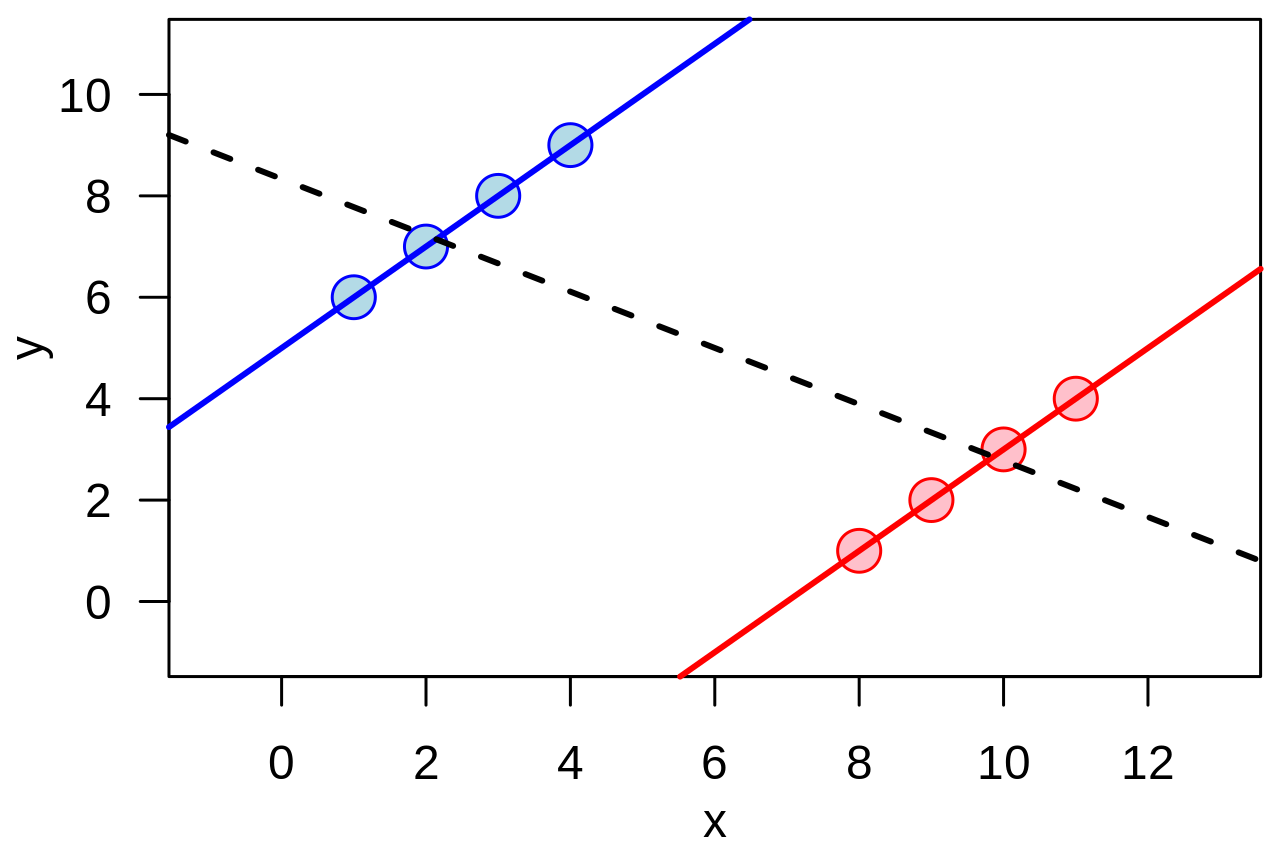
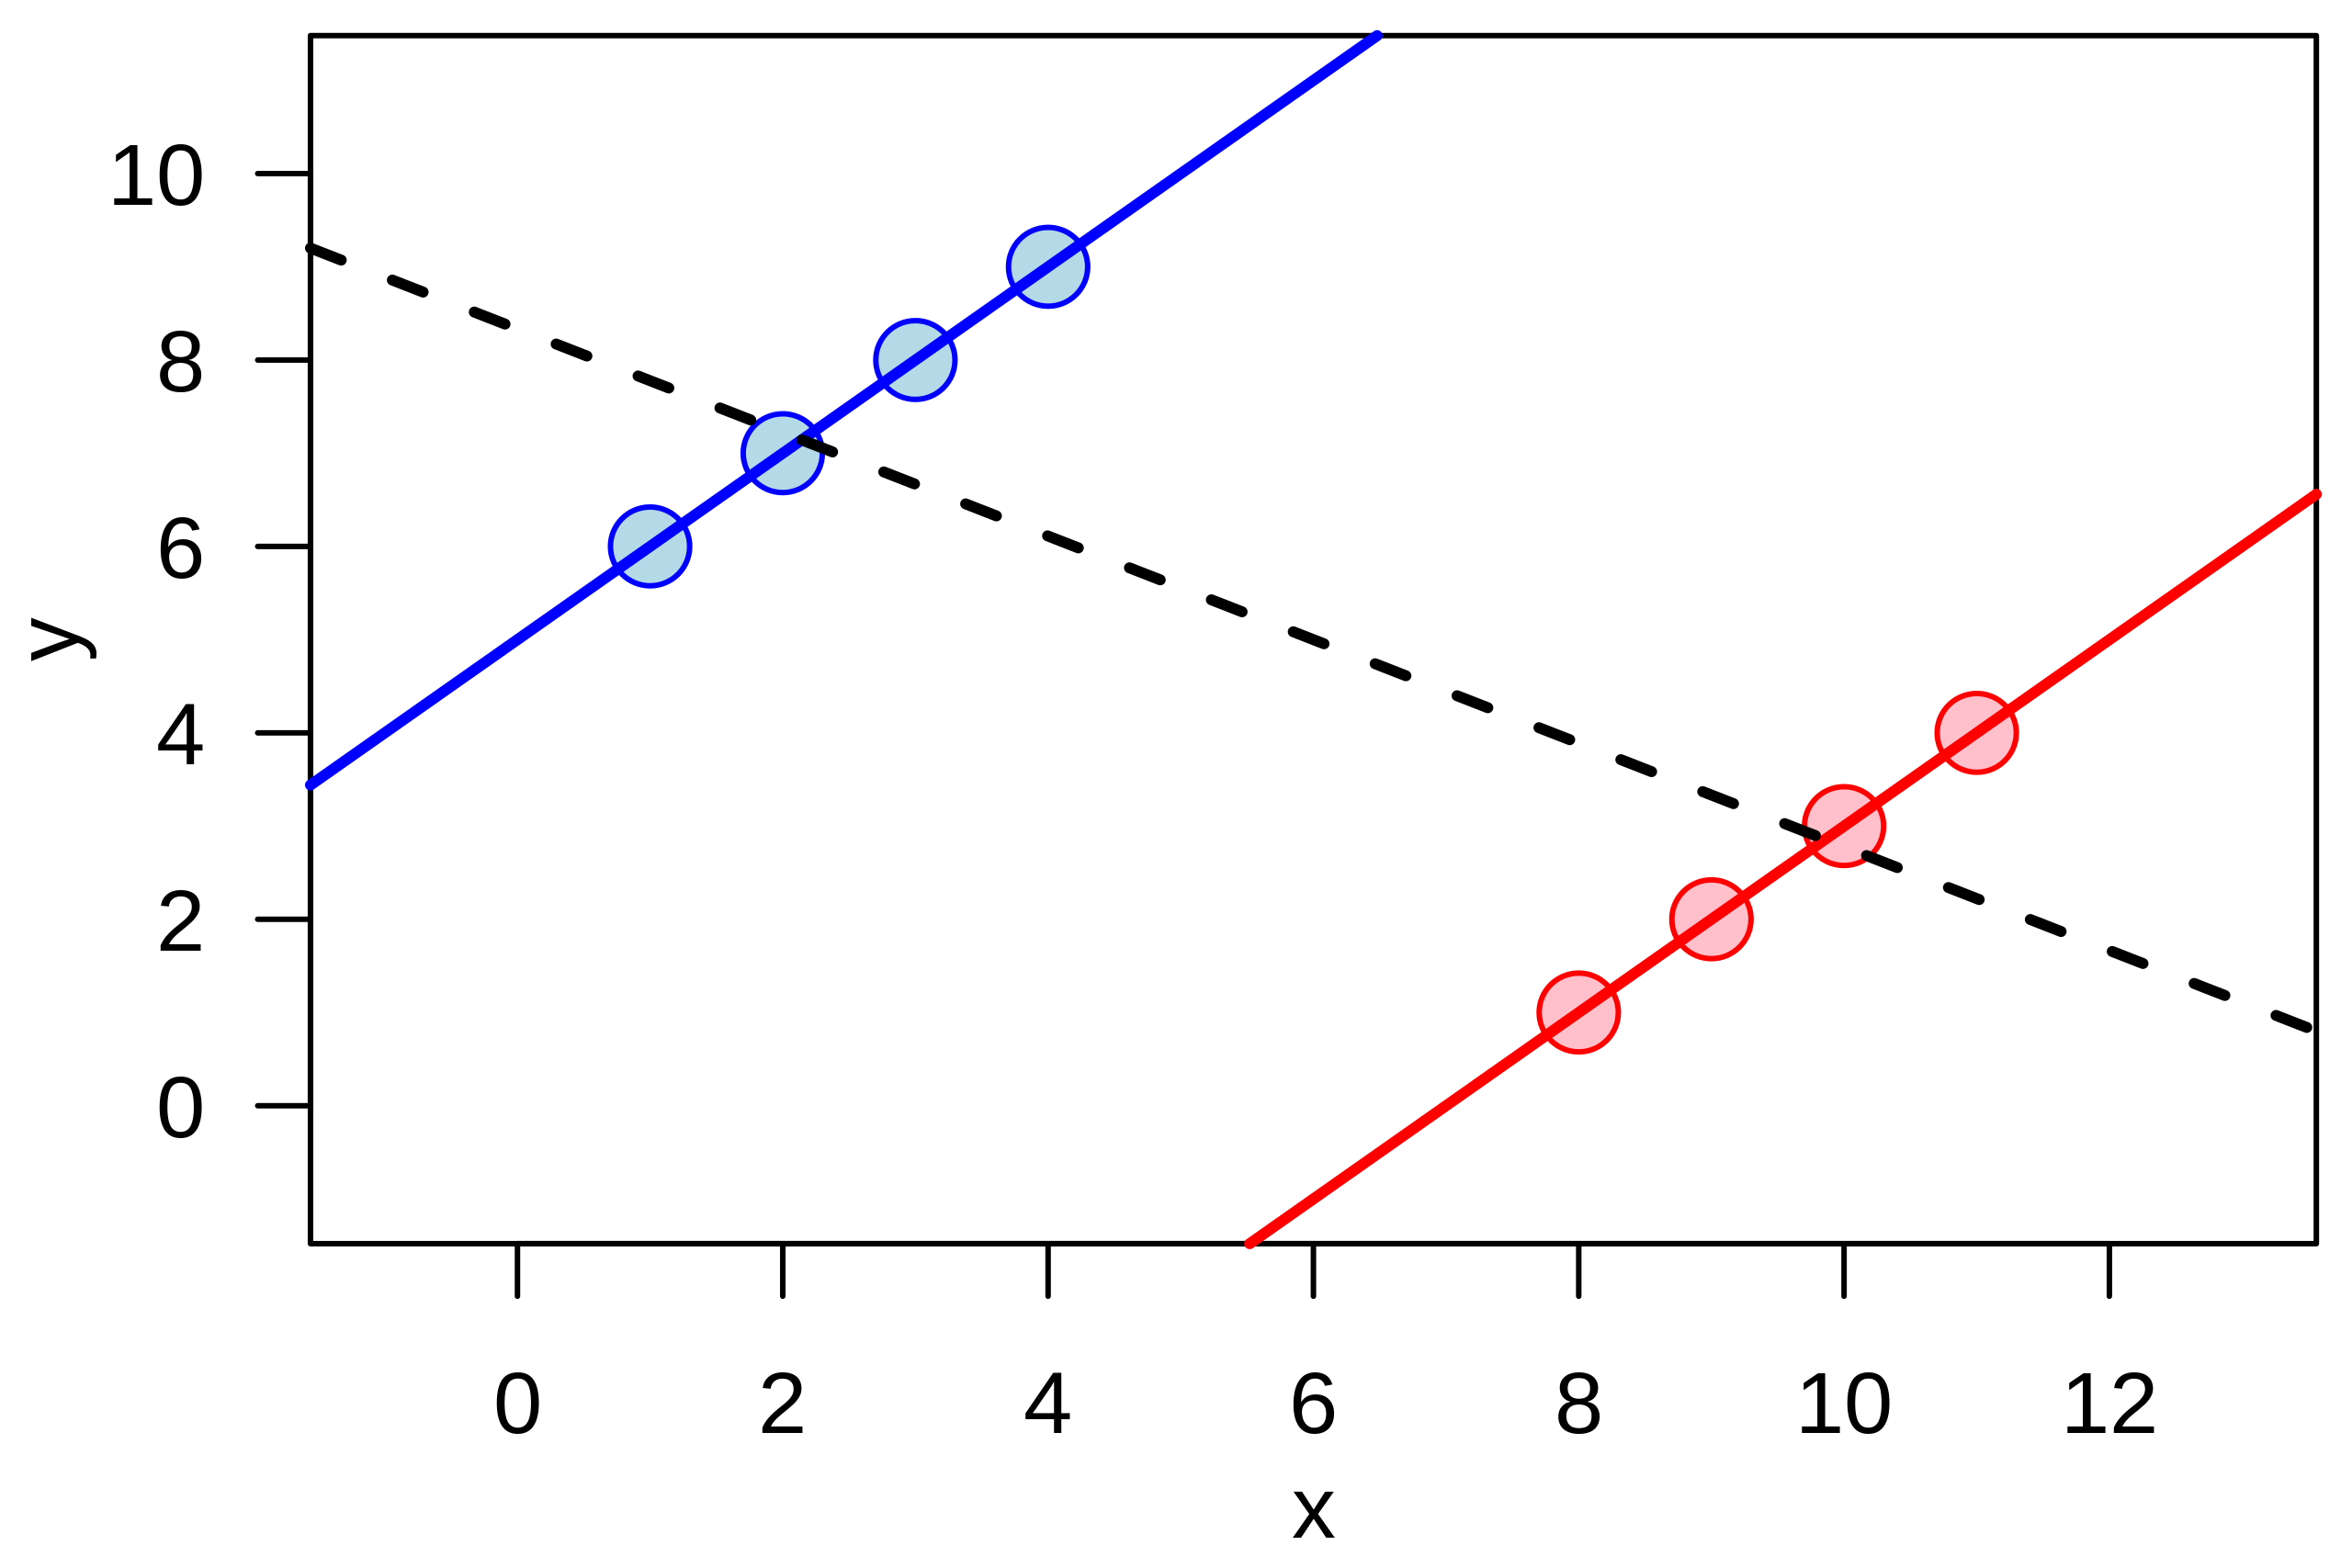
English: Illustration of the quantitative version of en:Simpson's paradox: a positive trend appears for two separate groups (blue and red), whereas a negative trend (black, dashed) appears when the groups are combined. |
| Päiväys | |
| Lähde | Oma teos |
| Tekijä | Schutz |
Example of the quantitative version of w:Simpson's paradox.
The graphic was created by User:Schutz for Wikipedia on 14 June 2007, using the R statistical project. The program that generated and exported the graphic is given below; the uploaded version was generated slightly differently to workaround a bug during the PS to SVG conversion with pstoedit command. The layout was slightly modified using Inkscape before upload.
  x1 <- c(1,2,3,4)
  y1 <- x1 + 5

  x2 <- x1 + 7
  y2 <- x2 - 7

  x <- c(x1,x2)
  y <- c(y1,y2)

  postscript("simpson.eps", paper="special", width=4.5, height=3)

  par(las=1)
  par(mar=c(3,3,0.5,0.5))
  par(mgp=c(2,1,0))

  plot(x,y, cex=2, pch=21,
       col=rep(c("blue", "red"), each=4), bg=rep(c("lightblue", "pink"), each=4),
       xlim=range(x)+c(-2,2), ylim=range(y)+c(-2,2))
  abline(lm(y1 ~ x1), col="blue", lwd=2)
  abline(lm(y2 ~ x2), col="red", lwd=2)
  abline(lm(y  ~ x), lwd=2, lty=2)

  dev.off()
Tämä vektorigrafiikkatiedosto luotiin käyttäen apuna ohjelmaa R.
Lisenssi
| Tämän teoksen tekijä, I, Schutz, on julkaissut sen public domainiin. Tämä on voimassa maailmanlaajuisesti. Joissain maissa laki ei mahdollista tätä. Mikäli näin on: I, Schutz myöntää kaikille oikeuden käyttää tätä teosta mihin tahansa tarkoitukseen ilman minkäänlaisia ehtoja, ellei laki vaadi ehtojen asettamista. |
Tämä vektorigrafiikkatiedosto luotiin käyttäen apuna ohjelmaa R.
Tiedoston historia
Päiväystä napsauttamalla näet, millainen tiedosto oli kyseisellä hetkellä.
| Päiväys | Pienoiskuva | Koko | Käyttäjä | Kommentti | |
|---|---|---|---|---|---|
| nykyinen | 14. kesäkuuta 2007 kello 02.15 | | 390 × 260 (18 KiB) | Schutz | {{Information |Description=Illustration of the continuous version of Simpson's paradox |Source=self-made |Date=14 June 2007 |Author=Schutz }} Example of the continuous version of w:Simpson's paradox. The graphic was created by [[User |
Tiedoston käyttö
Seuraava sivu käyttää tätä tiedostoa:
Tiedoston järjestelmänlaajuinen käyttö
Seuraavat muut wikit käyttävät tätä tiedostoa:
- Käyttö kohteessa ar.wikipedia.org
- Käyttö kohteessa ca.wikipedia.org
- Käyttö kohteessa cs.wikipedia.org
- Käyttö kohteessa cy.wikipedia.org
- Käyttö kohteessa de.wikipedia.org
- Käyttö kohteessa en.wikipedia.org
- Käyttö kohteessa es.wikipedia.org
- Käyttö kohteessa eu.wikipedia.org
- Käyttö kohteessa fr.wikipedia.org
- Käyttö kohteessa he.wikipedia.org
- Käyttö kohteessa ko.wikipedia.org
- Käyttö kohteessa nl.wikipedia.org
- Käyttö kohteessa no.wikipedia.org
- Käyttö kohteessa pl.wikipedia.org
- Käyttö kohteessa pt.wikipedia.org
- Käyttö kohteessa ru.wikipedia.org
- Käyttö kohteessa sk.wikipedia.org
- Käyttö kohteessa ta.wikipedia.org
- Käyttö kohteessa uk.wikipedia.org
- Käyttö kohteessa vi.wikipedia.org
- Käyttö kohteessa www.wikidata.org
- Käyttö kohteessa zh.wikipedia.org