Tiedosto:Wavestats.svg

Tämän PNG-esikatselun koko koskien SVG-tiedostoa: 741 × 336 kuvapistettä. Muut resoluutiot: 320 × 145 kuvapistettä | 640 × 290 kuvapistettä | 1 024 × 464 kuvapistettä | 1 280 × 580 kuvapistettä | 2 560 × 1 161 kuvapistettä.
Alkuperäinen tiedosto (SVG-tiedosto; oletustarkkuus 741 × 336 kuvapistettä; tiedostokoko 19 KiB)
| Tämä tiedosto on tiedostotietokanta Wikimedia Commonsista. Tiedot kuvaussivulta näkyvät alla. |  |
Tiedoston kuvaussivu Commonsissa |
Yhteenveto
| Kuvaus |
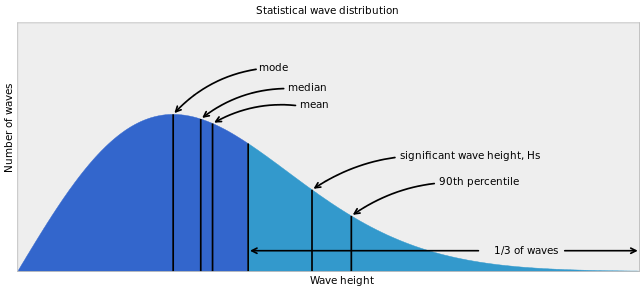
English: Wave Statistics |
| Lähde |
|
| Tekijä | NOAA |
| SVG kehittely | Tämä vektorigrafiikkatiedosto luotiin käyttäen apuna ohjelmaa Matplotlib/Adobe. This plot uses embedded text that can be easily translated using a text editor. |
| Lähdekoodi | Python codeimport numpy as np
import scipy.stats
import matplotlib.pyplot as plt
maxx = 8.0
rc('text.latex', preamble='\usepackage{sfmath}')
rc('text', usetex=True)
rc('font', family='sans-serif')
x = np.arange(0,maxx,0.01)
rayl = scipy.stats.rayleigh(loc=0,scale=2)
p = rayl.pdf(x)
x67 = rayl.ppf(2/3.0)
idx0_67 = x < x67
maxidx = np.max(np.where(idx0_67)[0])
idx67_0 = x >= x67
idx67_0[maxidx] = True
fig = plt.figure(figsize=(10,4))
ax = fig.add_axes([0,0,1,1],frameon=True)
ax.set_ylim(0,0.48)
ax.set_xlim(0, maxx)
ax.fill_between(x[idx0_67],np.zeros(p.shape)[idx0_67], p[idx0_67], alpha=0.5, color=(0.2,0.4,0.8))
ax.fill_between(x[idx67_0],np.zeros(p.shape)[idx67_0], p[idx67_0], alpha=0.5, color=(0.2,0.6,0.8))
ax.vlines(x67, 0, rayl.pdf(x67), linewidth=2, alpha=0.5)
ax.vlines(rayl.kwds['scale'], 0, rayl.pdf(rayl.kwds['scale']), linewidth=2, alpha=0.5)
ax.annotate("mode",
xy=(rayl.kwds['scale'], rayl.pdf(rayl.kwds['scale'])), xycoords='data',
xytext=(100, 50), textcoords='offset points',
va="bottom", ha="left",
arrowprops=dict(arrowstyle="->",
connectionstyle="arc3,rad=0.2",
mutation_scale=15,
linewidth=2,
edgecolor='black'
),
fontsize='large')
ax.vlines(rayl.median(), 0, rayl.pdf(rayl.median()), linewidth=2, alpha=0.5)
ax.annotate("median",
xy=(rayl.median(), rayl.pdf(rayl.median())), xycoords='data',
xytext=(100, 30), textcoords='offset points',
va="bottom", ha="left",
arrowprops=dict(arrowstyle="->",
connectionstyle="arc3,rad=0.2",
mutation_scale=15,
linewidth=2,
edgecolor='black'
),
fontsize='large')
ax.vlines(rayl.mean(), 0, rayl.pdf(rayl.mean()), linewidth=2, alpha=0.5)
ax.annotate(r"mean, $\bar{H}$",
xy=(rayl.mean(), rayl.pdf(rayl.mean())), xycoords='data',
xytext=(100, 10), textcoords='offset points',
va="bottom", ha="left",
arrowprops=dict(arrowstyle="->",
connectionstyle="arc3,rad=0.2",
mutation_scale=15,
linewidth=2,
edgecolor='black'
),
fontsize='large')
ax.vlines(rayl.ppf(5/6.0), 0, rayl.pdf(rayl.ppf(5/6.0)), linewidth=2, alpha=0.5)
ax.annotate("significant wave height, $H_{S}$",
xy=(rayl.ppf(5/6.0), rayl.pdf(rayl.ppf(5/6.0))), xycoords='data',
xytext=(100, 30), textcoords='offset points',
va="bottom", ha="left",
arrowprops=dict(arrowstyle="->",
connectionstyle="arc3,rad=0.2",
mutation_scale=15,
linewidth=2,
edgecolor='black'
),
fontsize='large')
ax.vlines(rayl.ppf(9/10.0), 0, rayl.pdf(rayl.ppf(9/10.0)), linewidth=2, alpha=0.5)
ax.annotate("90th percentile, $H_{1/10}$",
xy=(rayl.ppf(9/10.0), rayl.pdf(rayl.ppf(9/10.0))), xycoords='data',
xytext=(100, 30), textcoords='offset points',
va="bottom", ha="left",
arrowprops=dict(arrowstyle="->",
connectionstyle="arc3,rad=0.2",
mutation_scale=15,
linewidth=2,
edgecolor='black'
),
fontsize='large')
center = (maxx+rayl.ppf(2/3.0))/2.0+1
ax.text(center, 0.04, '1/3 of waves', ha='center', va='center', fontsize='large')
arrow = matplotlib.patches.FancyArrowPatch(
posA=(rayl.ppf(4/6.0), 0.04), posB=(center, 0.04), arrowstyle='<-',
mutation_scale=15.0, linewidth=2, edgecolor='black',
shrinkB=50
)
ax.add_patch(arrow)
arrow = matplotlib.patches.FancyArrowPatch(
posA=(center, 0.04), posB=(maxx, 0.04), arrowstyle='->',
mutation_scale=15.0, linewidth=2, edgecolor='black',
shrinkA=50
)
ax.add_patch(arrow)
ax.set_xlabel('wave height', size='x-large')
ax.set_xticks([])
ax.set_ylabel('number of waves',size='x-large')
ax.set_yticks([])
ax.set_title('Statistical wave distribution')
|
Lisenssi
Tämän teoksen on valmistanut Yhdysvaltain liittovaltion sää- ja valtamerentutkimusorganisaation (National Oceanic and Atmospheric Administration, NOAA) työntekijä kyseisen henkilön virallisten kurssien tai tointen aikana. Yhdysvaltain liittovaltion viranomaisten työntekijöiden tekemät teokset eivät saa tekijänoikeuden suojaa Yhdysvaltain tekijänoikeuslain 105 § mukaisesti.
|
Alkuperäinen tallennusloki
Siirretty projektista en.wikipedia Commonsiin käyttäjän SiggyF toimesta työkalulla CommonsHelper.
Alkuperäinen kuvaussivu oli täällä. Käyttäjätunnukset alla viittaavat kohteeseen en.wikipedia.
- 2009-12-09 15:06 Hurricaneg 500×300× (10286 bytes) {{Information |Description = Wave Statistics |Source = NOAA UCAR COMET Program |Date = ~~~~~ |Author = COMET PROGRAM |Permission = Public |other_versions = n/a }}
Tiedoston historia
Päiväystä napsauttamalla näet, millainen tiedosto oli kyseisellä hetkellä.
| Päiväys | Pienoiskuva | Koko | Käyttäjä | Kommentti | |
|---|---|---|---|---|---|
| nykyinen | 2. elokuuta 2012 kello 00.15 | | 741 × 336 (19 KiB) | SiggyF | {{Information |Description={{en|Wave Statistics}} |Source=Transferred from [http://en.wikipedia.org en.wikipedia]; transferred to Commons by User:SiggyF using [http://tools.wikimedia.de/~magnus/commonshelper.php CommonsHelper].<br/> Regenerated usi... |
Tiedoston käyttö
Seuraava sivu käyttää tätä tiedostoa:
Tiedoston järjestelmänlaajuinen käyttö
Seuraavat muut wikit käyttävät tätä tiedostoa:
- Käyttö kohteessa en.wikipedia.org
- Käyttö kohteessa es.wikipedia.org
- Käyttö kohteessa fa.wikipedia.org
- Käyttö kohteessa nl.wikipedia.org
- Käyttö kohteessa pt.wikipedia.org