Tiedosto:Carbon Dioxide 800kyr.svg

Alkuperäinen tiedosto (SVG-tiedosto; oletustarkkuus 502 × 339 kuvapistettä; tiedostokoko 52 KiB)
| Tämä tiedosto on tiedostotietokanta Wikimedia Commonsista. Tiedot kuvaussivulta näkyvät alla. |  |
Tiedoston kuvaussivu Commonsissa |
Yhteenveto

|
Tässä SVG-tiedostossa on tekstiä, jonka voi kääntää helposti suomen kielelle käyttäen SVG-editoria kuten Inkscapea tai Adobe Illustratoria. Lisätietoja on sivulla Commons:Translation possible/Learn more. Voit myös ladata ja tallentaa sen, ja kääntää sen manuaalisesti tekstimuokkaimella. |
| Kuvaus |
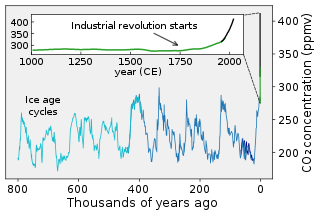
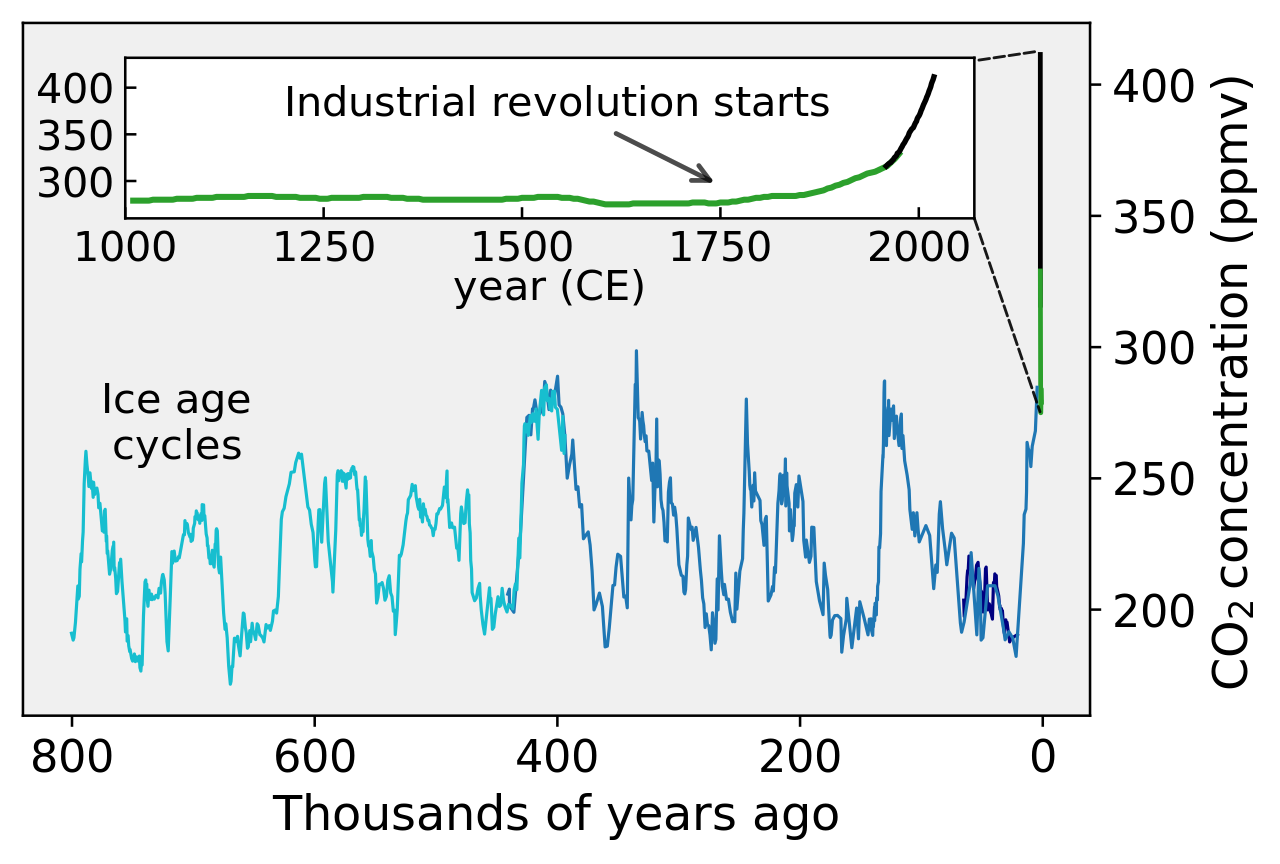
English: This figure shows the variations in concentration of carbon dioxide (CO2) in the atmosphere during the last 800 thousand years. Throughout most of the record, the largest changes can be related to glacial/interglacial cycles within the current ice age. Although the glacial cycles are thought to be directly caused by changes in the Earth's orbit (i.e. Milankovitch cycles), these changes also influence the carbon cycle, which in turn feeds back into the glacial system.
Since the Industrial Revolution, circa 1800, the burning of fossil fuels has caused a rapid increase of CO2 in the atmosphere, reaching levels unprecedented in the last million years. This increase has been implicated as a primary cause of global warming. The spacing of carbon dioxide samples varies through time. At the present, the atmosphere is sampled routinely and complete annual averages are available. From the four ice cores presented on this plot the sampling varies from as rapid as one point every few years (recent parts of the Law Dome record) to as sparse as one sample every few thousand years (oldest parts of the Vostok and Dome C records). In principle, the sparse sampling in the oldest parts of the record could hide abrupt excursions; however, isotopic measurements of ice cores (which are made continuously along the entire core) and our current understanding of the rates of natural processes for creating and removing carbon dioxide from the atmosphere make it unlikely that any positive excursions in carbon dioxide comparable to the Industrial Revolution have happened during the interval presented above. This figure is an update on File:Carbon Dioxide 400kyr.png, originally made by User: Dragons flight originally made by Dragons flight. The explanation of the figure is also derived from that work. Two new data sets are added: the CO2 measurements from 2004 to 2019 and additional data from Dome C. Some other data sets were omitted for simplicity. The code to produce this figure is freely available on Github: https://github.com/Femkemilene/Global-Warming-Figures. The first few lines of the code make it easy to change the language. |
| Päiväys | |
| Lähde | Oma teos |
| Tekijä | Femke Nijsse |
| Muut versiot |
File:Carbon Dioxide 800kyr.svg has 4 embedded translations.
|


Data sources
- (light blue) Dome C ice core: Lüthi, D., M. Le Floch, B. Bereiter, T. Blunier, J.-M. Barnola, U. Siegenthaler, D. Raynaud, J. Jouzel, H. Fischer, K. Kawamura, and T.F. Stocker (2008). "High-resolution carbon dioxide concentration record 650,000-800,000 years before present". Nature 453: 379-382. DOI:10.1038/nature06949.
- (dark blue) Vostok ice core: Fischer, H., M. Wahlen, J. Smith, D. Mastroianni, and B. Deck (1999). "Ice core records of Atmospheric CO2 around the last three glacial terminations". Science 283: 1712-1714.
- (navy blue) Taylor Dome ice core: Indermühle, A., E. Monnin, B. Stauffer, T.F. Stocker, M. Wahlen (1999). "Atmospheric CO2 concentration from 60 to 20 kyr BP from the Taylor Dome ice core, Antarctica". Geophysical Research Letters 27: 735-738.
- (green) Law Dome ice core: D.M. Etheridge, L.P. Steele, R.L. Langenfelds, R.J. Francey, J.-M. Barnola and V.I. Morgan (1998) "Historical CO2 records from the Law Dome DE08, DE08-2, and DSS ice cores" in Trends: A Compendium of Data on Global Change. Carbon Dioxide Information Analysis Center, Oak Ridge National Laboratory, U.S. Department of Energy, Oak Ridge, Tenn., U.S.A.
- (black) Mauna Loa Observatory, Hawaii: Keeling, C.D. and T.P. Whorf (2004) "Atmospheric CO2 records from sites in the SIO air sampling network" in Trends: A Compendium of Data on Global Change. Carbon Dioxide Information Analysis Center, Oak Ridge National Laboratory, U.S. Department of Energy, Oak Ridge, Tenn., U.S.A.
Lisenssi
- Voit:
- jakaa – kopioida, levittää ja esittää teosta
- remiksata – valmistaa muutettuja teoksia
- Seuraavilla ehdoilla:
- nimeäminen – Sinun on mainittava lähde asianmukaisesti, tarjottava linkki lisenssiin sekä merkittävä, mikäli olet tehnyt muutoksia. Voit tehdä yllä olevan millä tahansa kohtuullisella tavalla, mutta et siten, että annat ymmärtää lisenssinantajan suosittelevan sinua tai teoksen käyttöäsi.
- jaa samoin – Jos muutat tai perustat tähän työhön, voit jakaa tuloksena syntyvää työtä vain tällä tai tämän kaltaisella lisenssillä.
Tiedoston historia
Päiväystä napsauttamalla näet, millainen tiedosto oli kyseisellä hetkellä.
| Päiväys | Pienoiskuva | Koko | Käyttäjä | Kommentti | |
|---|---|---|---|---|---|
| nykyinen | 16. toukokuuta 2023 kello 14.18 | | 502 × 339 (52 KiB) | Pedalito | File uploaded using svgtranslate tool (https://svgtranslate.toolforge.org/). Added translation for de. |
| 19. huhtikuuta 2022 kello 21.05 |  | 502 × 339 (50 KiB) | Jiaminglimjm | File uploaded using svgtranslate tool (https://svgtranslate.toolforge.org/). Added translation for id. | |
| 9. tammikuuta 2022 kello 06.41 |  | 502 × 339 (48 KiB) | TAKAHASHI Shuuji | File uploaded using svgtranslate tool (https://svgtranslate.toolforge.org/). Added translation for ja. | |
| 17. joulukuuta 2021 kello 17.11 |  | 502 × 339 (46 KiB) | Femke | File uploaded using svgtranslate tool (https://svgtranslate.toolforge.org/). Added translation for nl. | |
| 11. syyskuuta 2020 kello 18.44 |  | 502 × 339 (41 KiB) | Femke | Remove the circle for the inset. I changed the axis limits so that the line doesn't cross the year 2000 any more. Made the connecting lines dashed. | |
| 29. maaliskuuta 2020 kello 19.28 |  | 502 × 339 (41 KiB) | Femke | Again, spaces seem to be removed when I try to make text editable. | |
| 29. maaliskuuta 2020 kello 19.27 |  | 502 × 339 (41 KiB) | Femke | fontsize increase, update to 2019, colour change for one of the lines, fatter arrow. | |
| 10. kesäkuuta 2018 kello 16.22 |  | 509 × 344 (68 KiB) | Femke | Changed the background color to a more neutral color. Changed the rectangle to oval to indicate that the inset figure zooms in further than the rectangle showed before. | |
| 27. toukokuuta 2018 kello 14.58 |  | 509 × 344 (68 KiB) | Femke | User created page with UploadWizard |
Tiedoston käyttö
Seuraava sivu käyttää tätä tiedostoa:
Tiedoston järjestelmänlaajuinen käyttö
Seuraavat muut wikit käyttävät tätä tiedostoa:
- Käyttö kohteessa ar.wikipedia.org
- Käyttö kohteessa ar.wikiversity.org
- Käyttö kohteessa arz.wikipedia.org
- Käyttö kohteessa az.wikipedia.org
- Käyttö kohteessa dag.wikipedia.org
- Käyttö kohteessa de.wikipedia.org
- Käyttö kohteessa en.wikipedia.org
- Causes of climate change
- Carbon cycle
- Climate variability and change
- Climate change
- Atmospheric carbon cycle
- Wikipedia:WikiProject Climate change/Figures
- 2022 in science
- Portal:Climate change
- User talk:Femke/Archive 2
- Talk:Climate variability and change/Archive 8
- User talk:InformationToKnowledge/sandbox
- Käyttö kohteessa en.wikibooks.org
- Käyttö kohteessa ha.wikipedia.org
- Käyttö kohteessa hu.wikipedia.org
- Käyttö kohteessa hy.wikipedia.org
- Käyttö kohteessa id.wikipedia.org
- Käyttö kohteessa ja.wikipedia.org
- Käyttö kohteessa ko.wikipedia.org
- Käyttö kohteessa ku.wikipedia.org
- Käyttö kohteessa kw.wikipedia.org
- Käyttö kohteessa mk.wikipedia.org
- Käyttö kohteessa ru.wikipedia.org
- Käyttö kohteessa ru.wikinews.org
- Käyttö kohteessa rw.wikipedia.org
- Käyttö kohteessa ta.wikipedia.org
- Käyttö kohteessa te.wikipedia.org
- Käyttö kohteessa th.wikipedia.org
- Käyttö kohteessa tr.wikipedia.org
- Käyttö kohteessa www.wikidata.org
- Käyttö kohteessa zh.wikipedia.org